
- Tue 20 February 2018
- brightway2

Sometimes we need to calculate something outside the standard LCA equations. In this blog post, I will show you how I recently did three such calculations using Brightway. There is an accompanying notebook which provides complete code examples.
How important is electricity?
At PSI, we work a lot on energy production and consumption, and supply lots of electricity and mobility datasets to ecoinvent. A natural question for us is therefore just how important (in terms of share of environmental impact) our datasets are. This is a bit tricky to calculate, as we want to estimate the cumulative impact of electricity everywhere it is supplied in the supply chain. You could try manually traversing the supply chain, calculating the impact of an electricity input each time it was encountered, but that sounds long and tiresome. Instead, we can be clever and compare the impact of an activity with and without any electricity in the system - the difference is the fraction of the impact that comes from electricity consumption. Instead of zeroing out each electricity input by hand in the technosphere matrix, but we can skip some work by building on top of the Wurst framework, which has a number of built-in manipulation functions. The key is the create a copy of ecoinvent, zero out the electricity inputs for each activity, and then... well, then you are done!
When working with ecoinvent, you should expect the unexpected. Our initial guess is that electricity inputs will have the unit "kilowatt hour", but we need to check this - and we need to check to make sure that there aren't any electricity inputs with have a different energetic unit. We do both these checks manually in the accompanying notebook.
Here is the code to set each electricity input to zero:
import wurst as w
ecoinvent = w.brightway.extract_brightway2_databases(["ecoinvent 3.4 cutoff"])
kwh = w.equals("unit", "kilowatt hour")

for dataset in ecoinvent:
    for exchange in w.technosphere(dataset, kwh):
        exchange['amount'] = 0

w.brightway.write_brightway2_database(ecoinvent, "3.4 no electricity")
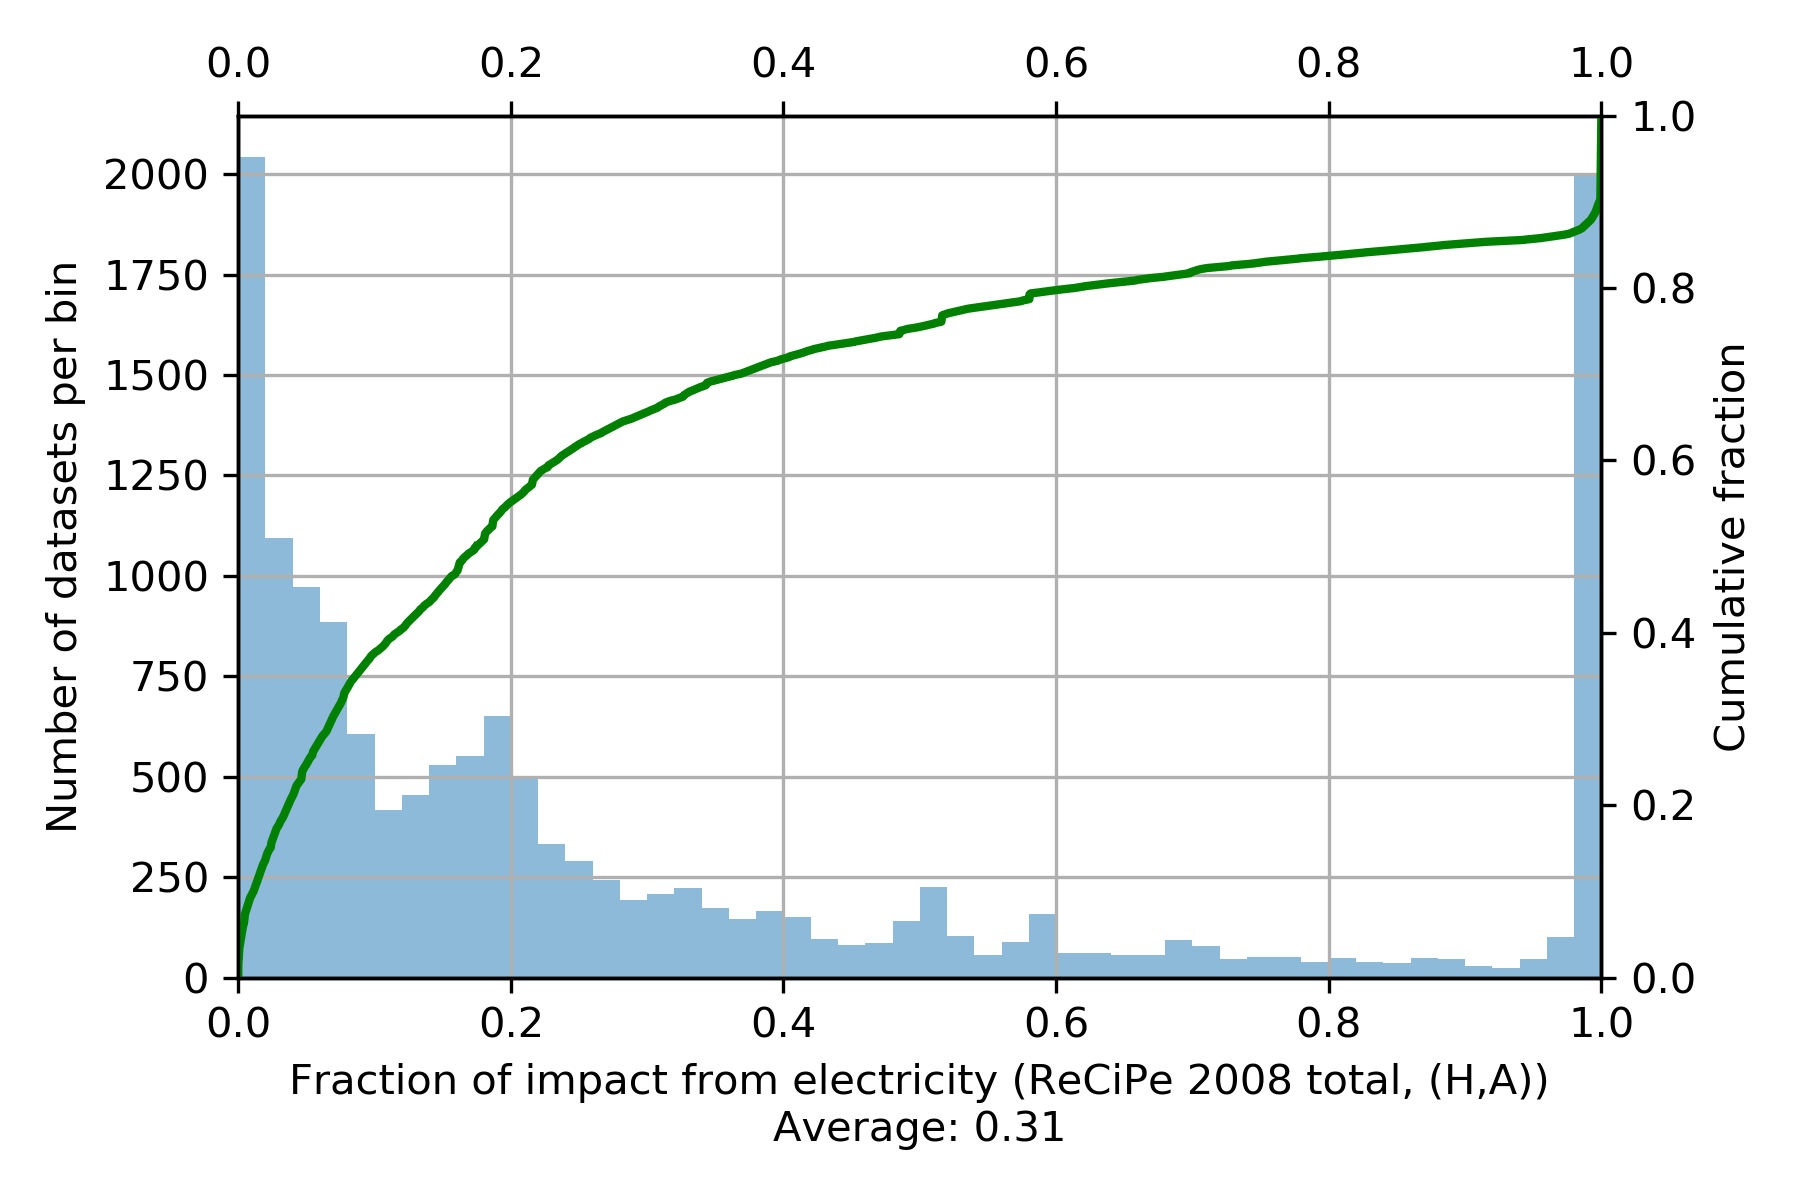
Due to our recent speedups, it is quite reasonable to calculate LCIA scores for all activities in ecoinvent 3.4 (something like three minutes, depending on your computer); when we compare the scores of the original and the modified database, we see that electricity accounts for 31 percent of total impact on average for the ReCiPe total indicator (2008, hierarchist perspective).
Grouping impact by location
Brightway has a complete regionalization framework, but sometimes you want to do a quick and dirty calculation, or just want to know the total score of some LCIA method by location. We can calculate the characterized matrix for a given functional unit. In the conventional LCA equation, the dimensions collapse, and the result is a 1 by 1 matrix:
However, Brightway doesn't do this - it loses a lot of information that we want! Instead, we diagonalize at key places to get a characterized inventory matrix with rows of biosphere flows, and columns of activities:
We know which activity is in which column, and so we know each column's associated location. We can then create a Pandas dataframe with the total score (summed over all rows) and location for each column, and then use Pandas groupby to sum each distinct location:
import brightway2 as bw
import pandas as pd

def dataframe_by_activity(activity, method):
    lca = bw.LCA({activity: 1}, method=method)
    lca.lci()
    lca.lcia()
    # 0 is the first dimension, i.e. biosphere flows
    activity_scores = lca.characterized_inventory.sum(axis=0)
    df = pd.DataFrame.from_dict([
            {
                'location': a['location'],
                # 0 because there is only one row in this matrix
                'score': activity_scores[0, lca.activity_dict[a]]
            }
        for a in bw.Database(activity['database'])
        # Skip activities with no impact - not actually necessary but cleaner
        if activity_scores[0, lca.activity_dict[a]] != 0])
    return df.groupby('location').sum().sort_values('score', ascending=False)
This works fine for individual calculations, but won't scale gracefully to many calculations. To do meta-analysis and be web scale, we need to do some work ahead of time, and construct mask arrays for each possible location. This works for multiple activities because of the way that matrices are built in Brightway - we have a guarantee that rows and columns will be built in the same order each time.
def faster_scores_by_location(database, method):
    db = bw.Database(database)
    lca = bw.LCA({db.random(): 1}, method=method)
    lca.lci()
    lca.lcia()

    location_mapping = {a: a['location'] for a in db}
    mask_by_location = {location: np.array([lca.activity_dict[key]
                                            for key, place in location_mapping.items()
                                            if location == place])
                        for location in set(location_mapping.values())}

    results = {}

    for activity in pyprind.prog_bar(db):
        lca.redo_lcia({activity: 1})
        # Pre-summing biosphere flows for 25x more performance
        summed_rows = lca.characterized_inventory.sum(axis=0)
        results[activity] = {location: float(summed_rows[0, array].sum())
                             for location, array in mask_by_location.items()}
        results[activity]['total'] = lca.score

    return results
We can use these results to see what fraction of impact occurs in global or "rest of the world" datasets. Note that, in contrast to the previous example, we don't trace the impact of each activity occurring in GLO or RoW throughout its supply chain, but instead are just adding up the direct emissions of each supply chain activity that occurs in GLO or RoW.
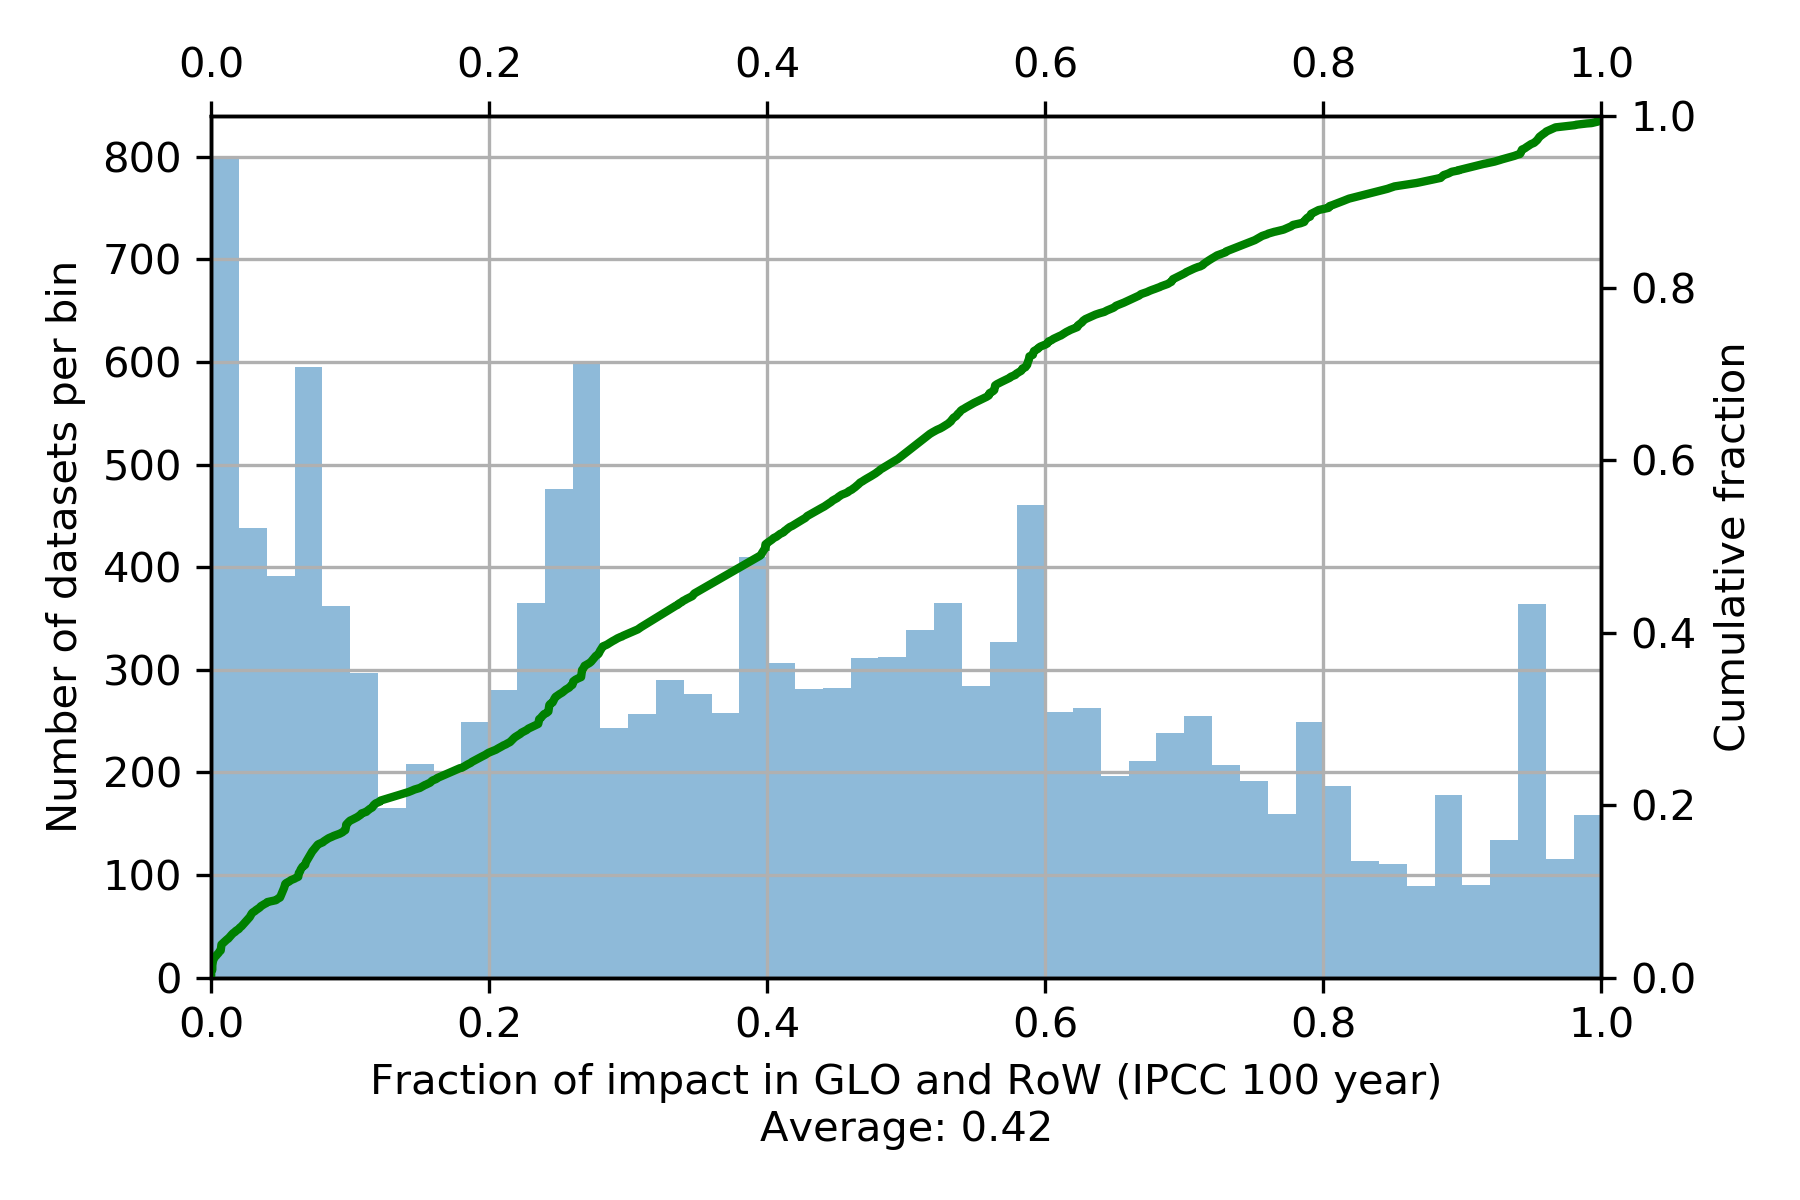
I think it is quite interesting how flat the CDF line is; I don't have an explanation for this behaviour.
Transportation distances by location
In addition to supporting standard LCA calculations, background databases like ecoinvent can be used to approximate the total amount of distance traveled by different means throughout the supply chain of a good or service. We should bear in mind that some of these database distances are rough estimates. In a recent project, we wanted to investigate whether the human health risk of traffic accidents for mobility technologies was higher during the direct use of the vehicle in a region with safe roads, such as Switzerland, or during all the other transportation steps throughout the supply chain of the car or truck. We know that the total distance in other countries will be much less, but could also be much more dangerous. To get these figures, we need to group by location, while filtering results for anything other than mobility activities. This turned out to be relatively easy, as it followed a similar pattern to grouping by location:
def transport_specific_dataframe_by_location(activity):
    lca = bw.LCA({activity: 1})
    lca.lci()
    df = pd.DataFrame.from_dict([
            {
                'location': a['location'],
                'unit': a['unit'],
                'score': (lca.supply_array[lca.activity_dict[a]]
                          - (1 if activity == a else 0)) # Subtract functional unit if f.u. is transport
            }
        for a in bw.Database(activity['database'])
        if lca.supply_array[lca.activity_dict[a]] != 0
        and a['unit'] in ('ton kilometer', 'person kilometer')
    ])
    return {
        'ton kilometer': df[df['unit'] == 'ton kilometer'].groupby('location').sum(
            ).sort_values('score', ascending=False),
        'person kilometer': df[df['unit'] == 'person kilometer'].groupby('location').sum(
            ).sort_values('score', ascending=False)
    }
In this example, we ignored the difference between different forms of freight transport, and just added all "ton kilometers" together - in a scientific paper, the different modal forms of freight transport should obviously be split.