- Mon 10 December 2012
- brightway2
- #notable
One important question in life cycle assessment (LCA) is whether the different indicators developed in the last two decades produce different different results from each other. Life cycle assessment covers a large variety of different environmental categories; here is a partial list:
- Eutrophication
- Acidification
- Global warming
- Short- and long-term ecotoxicity
- Acute damage to human health
- Human carcinogens
- Ozone depletion
- Ground level ozone formation
- Noise
- Water consumption
- Land occupation and transformation
However, it is important to remember that LCA exists to provie support for people making decisions - the absolute numbers are not as important as the relative values when comparing two different product systems, or the changes in a single product system. If all the indicators show that product A is better than product B, then we don't need to do the work to calculate scores for every impact category - we can jsut gather the necessary data for the easiest one, as they would all agree which system was better in any case. This question has been addressed in the literature: Huijbregts et al [1] examined the question of whether cumulative fossil energy demand was statistically independent of a host of other impact assessment methods for ecoinvent 1.2, and Berger and Finkbeiner later examined the independence of resource indicators for the GaBi database [2].
In this post I want to briefly show you how to calculate the correlation of different indicators using Brightway2. This is exactly the type of calculation that Brightway2 is good at, and the code itself is pretty easy. We will examine ecoinvent 2.2, and if you wanted to write a scientific publication, you would probably need to be a bit more systematic than we will be here.
First, we should remember a bit about LCA math. The key equation is:
On my laptop, Brightway2 should take about 0.4 seconds to do an LCA calculation. Ecoinvent 2.2 has about 4000 activities (and we will look at all of them), and we want to assess about 100 impact assessment methods, so we should think about what we can do to make this go a bit more quickly. First, we can factorize the technosphere matrix A; this will make solving the linear equation A^{-1}f very fast. Here is the setup code:
from brightway2 import *
from bw2calc import LCA
from scipy import stats, sparse
import numpy as np

ei = Database("ecoinvent 2.2").load()
# Get names of all IA methods
candidates = sorted(methods.list)
num_methods = len(candidates)
num_processes = len(ei)
# Empty array to write results to
output = np.zeros((num_processes, num_methods))

# Pick a random process to factorize the technosphere
lca = LCA({ei.keys()[0]: 1})
lca.lci(factorize=True)
Second, we can pre-load all the characterization matrices, instead of retrieving them from disk.
def build_ia_matrix(key, lca):
    lca.method = key
    # Load CF data for this matrix
    lca.load_method()
    count = len(lca.biosphere_dict)
    # Create sparse characterization matrix
    return sparse.coo_matrix(
        (lca.cf_params['amount'],
        (np.zeros(lca.cf_params['index'].shape[0],),
        lca.cf_params['index'])),
        (count, count)).tocsr()

lca_methods = dict([(key, self.build_ia_matrix(key, lca)
    ) for key in candidates])
Now, let's do the calculation; this is just a simple nested loop:
for row, key in enumerate(sorted(ei_data.keys())):
    # Build new demand array for each ecoinvent activity
    lca.build_demand_array({key: 1})
    for col, key in enumerate(candidates):
        # Write IA score for this activity and method
        output[row, col] = (
            lca_methods[key] * \
            lca.biosphere_matrix.data * \
            lca.solve_linear_system()).sum()
Instead of doing 2.5 LCA calculations a second, we are now up to 16,000 a second (!!), without even using tricks like multiprocessing. This is the potential of Brightway2.
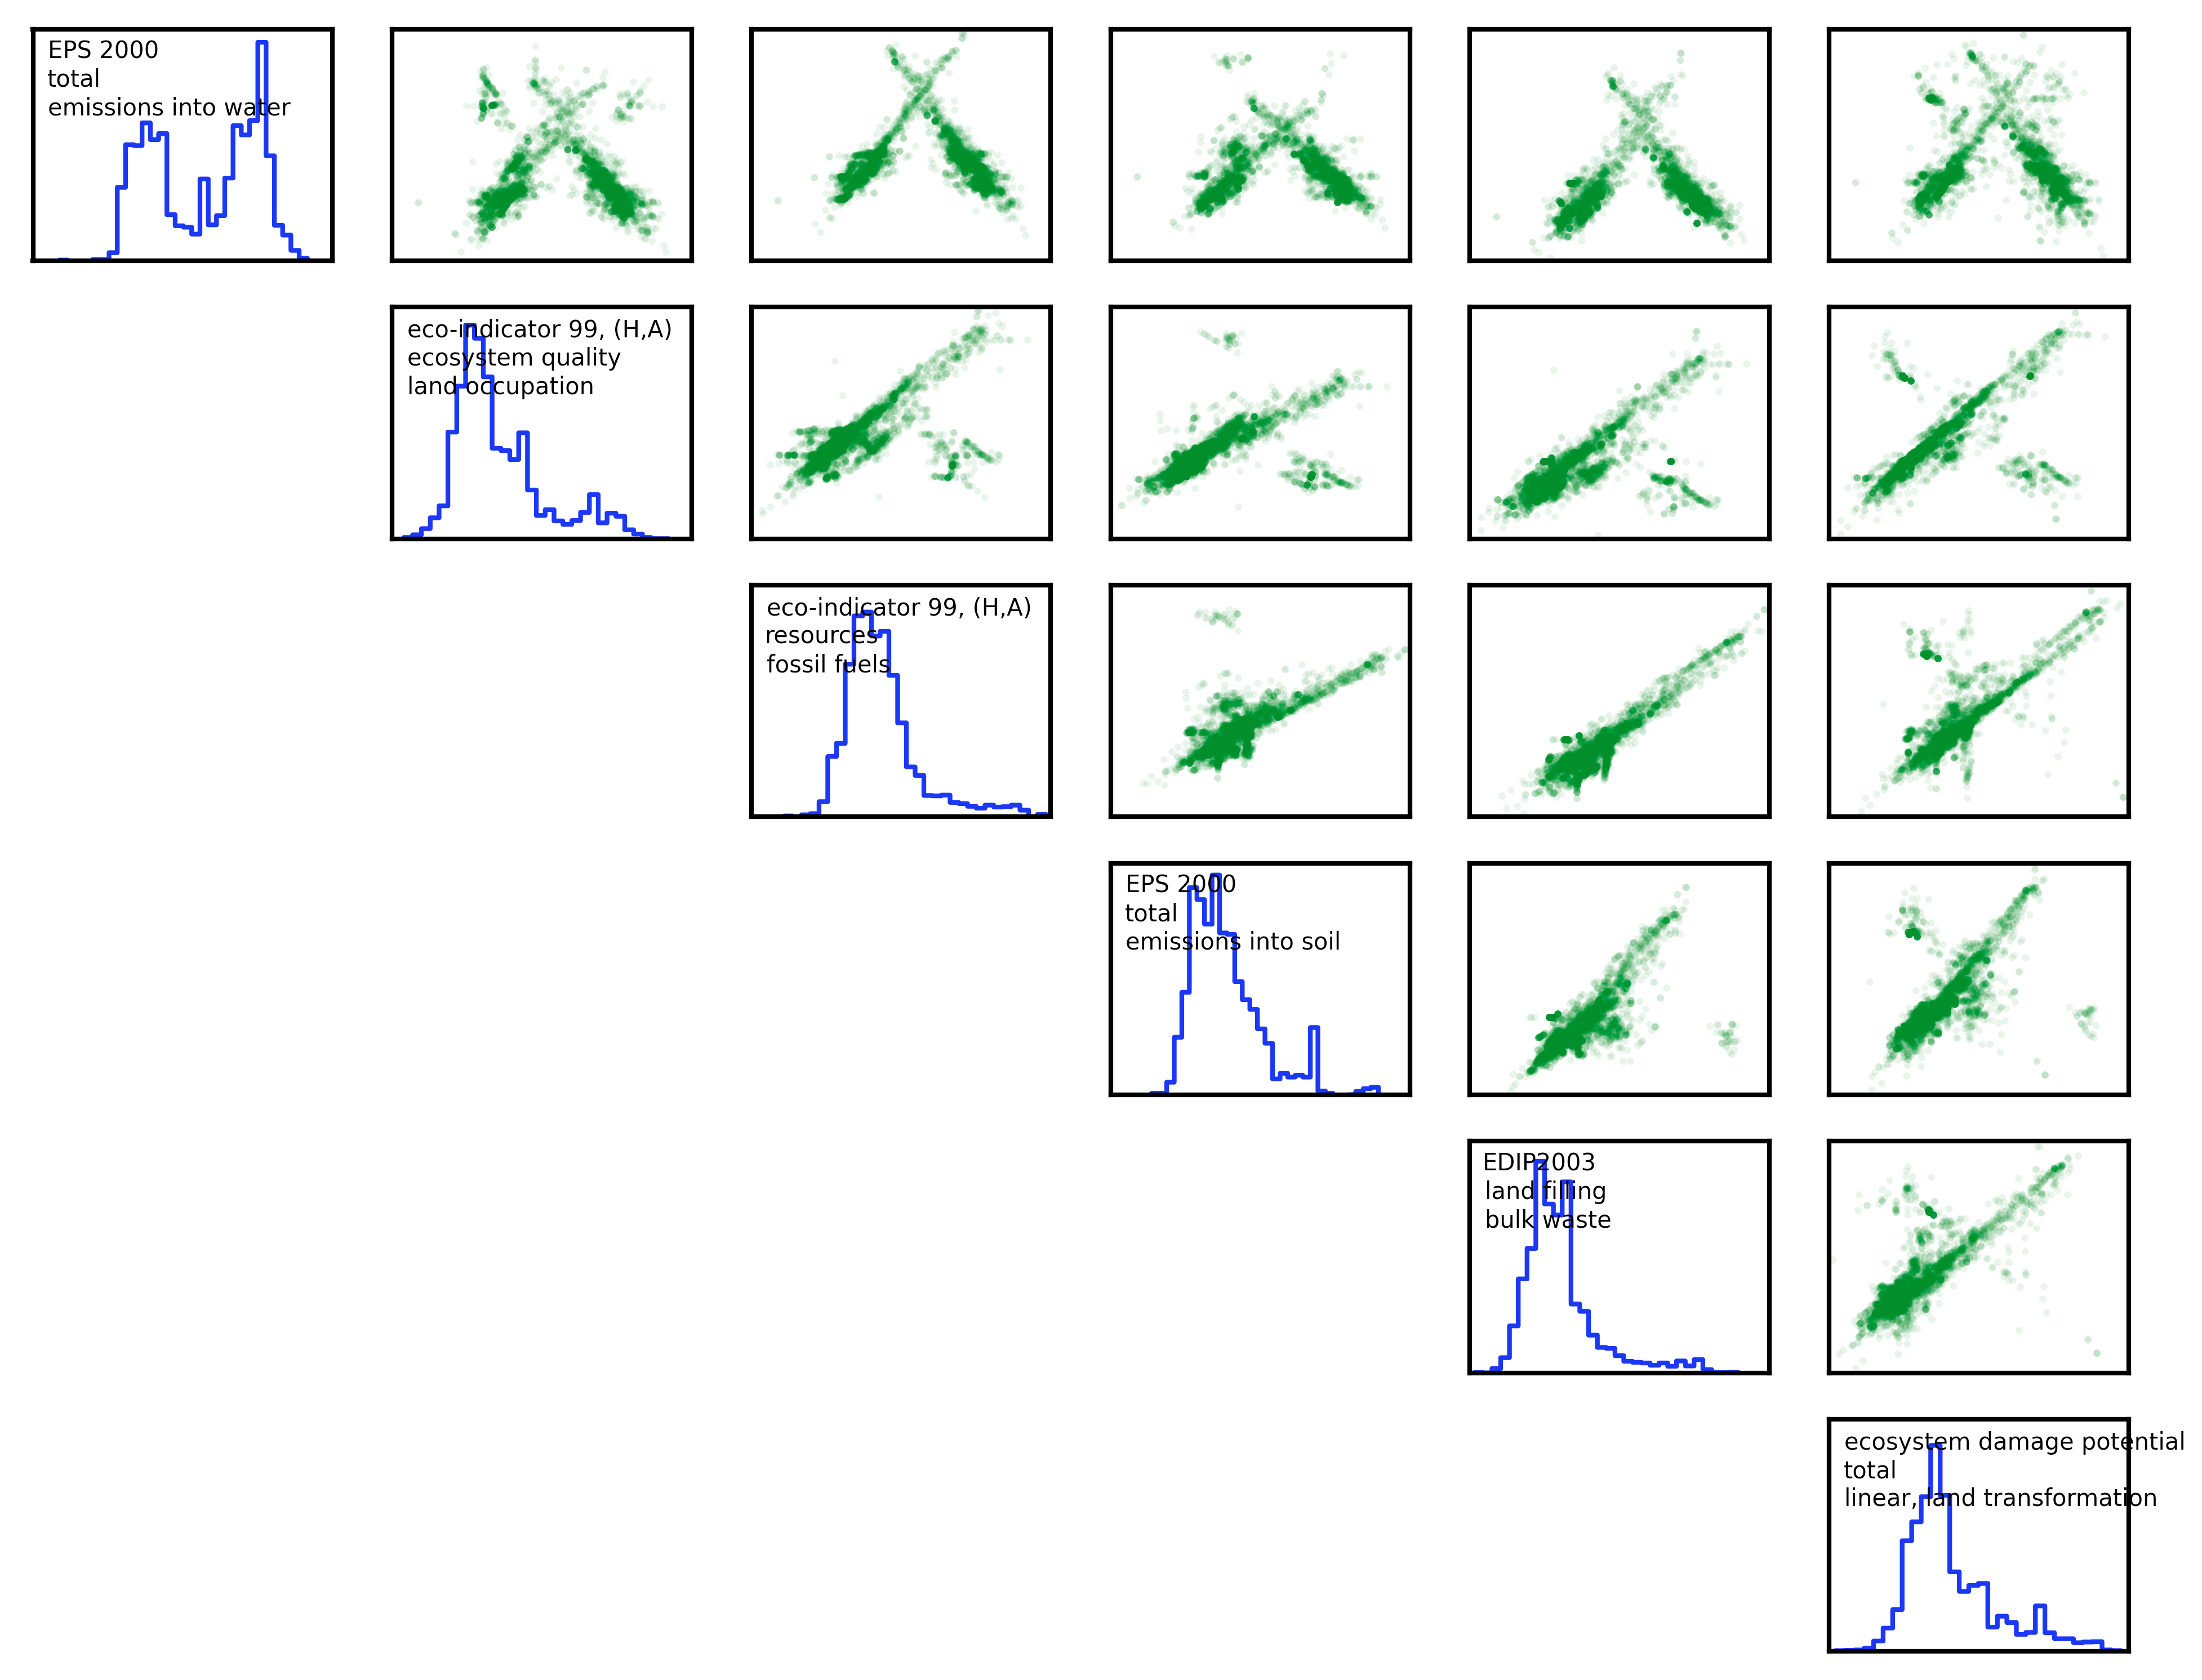
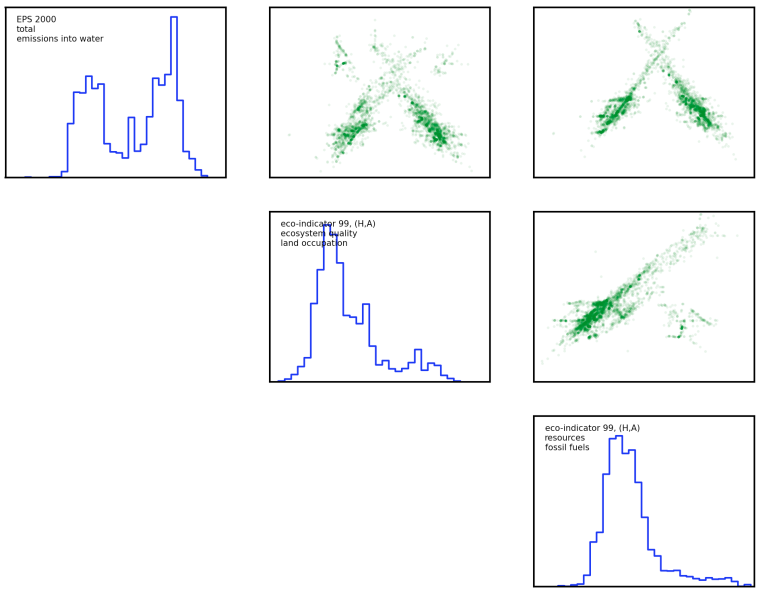
We also want to create a matrix of data showing how each impact assessment method's scores for each activity in ecoinvent 2.2 are correlated. Because these scores are not (anywhere close) to being normally distributed, even when log-transformed, we need to use a more robust measure of correlation. I chose the Spearman rank-order correlation cofficient.
results = np.zeros((num_methods, num_methods))

for row in range(num_methods):
    for col in range(num_methods):
        # Only need to calculate each pair-wise combination once
        if col <= row:
            continue
        data1 = output[:, row]
        data2 = output[:, col]
        pbar.update(count.next())
        # Don't include 0 values, as there is no correlation
        # information present.
        mask = (data1 != 0) * (data2 != 0)
        if mask.sum() == 0:
            # No IA scores at all!
            continue
        results[row, col] = stats.spearmanr(data1[mask], data2[mask]
            )[0]
The complete source code can be found at the repository for this blog. Every change and post is stored in version control.
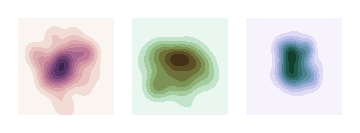
Here is a figure from the three least-correlated impact assessment methods; there are still clear patterns of correlation in activity scores to be found. You can also download a larger figure for the six least correlated methods here.
| [1] | Huijbregts, M. A. J., Rombouts, L. J. A., Hellweg, S., Frischknecht, R., Hendriks, A. J., Meent, D., Ragas, A. M. J., Reijnders, L., & Struijs, J. (2006). Is cumulative fossil energy demand a useful indicator for the environmental performance of products?. Environ. Sci. Technol, 40(3), 641--8. http://pubs.acs.org/doi/abs/10.1021/es051689g. |
| [2] | Berger, M. & Finkbeiner, M. (2011). Correlation analysis of life cycle impact assessment indicators measuring resource use. , 16(1), 74-81. http://link.springer.com/article/10.1007/s11367-010-0237-7. |